Measures of Dispersion — Class 11 Maharashtra HSC Mathematics revision notes
A 4-page visual revision sheet for Measures of Dispersion, written for Class 11 Maharashtra HSC Mathematics. Formulas, diagrams and the traps that cost marks, laid out to be read the night before rather than the term before. Free, and it opens inside CapCompass.
 Page 1 as PDF
Measures of Dispersion in one look
same mean, three very different teams: the average never tells the whole story
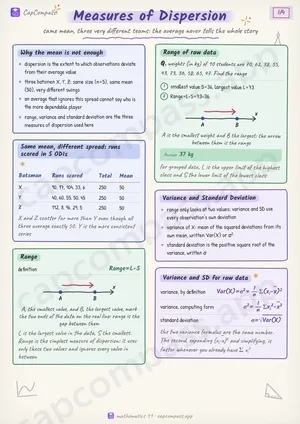
Why the mean is not enough
- dispersion is the extent to which observations deviate from their average value
- three batsmen X, Y, Z: same size (n=5), same mean (50), very different swings
- an average that ignores this spread cannot say who is the more dependable player
- range, variance and standard deviation are the three measures of dispersion used here
Same mean, different spread: runs scored in 5 ODIs
| Batsman | Runs scored | Total | Mean |
|---|---|---|---|
| X | 90, 17, 104, 33, 6 | 250 | 50 |
| Y | 40, 60, 55, 50, 45 | 250 | 50 |
| Z | 112, 8, 96, 29, 5 | 250 | 50 |
Range
- definition
Range=L-S
Range of raw data
Q. weights (in kg) of 10 students are 70, 62, 38, 55, 43, 73, 36, 58, 65, 47. Find the range
- smallest value S=36, largest value L=73
- Range=L-S=73-36
Answer: 37 kg
Variance and Standard Deviation
- range only looks at two values; variance and SD use every observation's own deviation
- variance of X: mean of the squared deviations from its own mean, written Var(X) or σ^2
- standard deviation is the positive square root of the variance, written σ
Variance and SD for raw data
- variance, by definition
Var(X)=σ^2=1/nΣ(x_i-x)^2 - variance, computing form
σ^2=1/nΣ x_i^2-x^2 - standard deviation
σ=√Var(X)
Page 1 of 4. The full sheet, all 4 pages, opens free in the app.
What this Measures of Dispersion sheet covers
- Why the mean is not enough
- Same mean, different spread: runs scored in 5 ODIs
- Range
- definition
- Range of raw data
- Variance and Standard Deviation
- Variance and SD for raw data
- variance, by definition
- variance, computing form
- standard deviation
- Why the shortcut variance formula works
- Variance and SD for frequency distributions
- ungrouped, values x_i with frequencies f_i
- grouped, x_i is the class mid-value
- where
- Variance of raw data
- Change of origin and scale
- Step-deviation method
- substitution, A a convenient origin, h the class width
- SD relation
- variance relation
- Step-deviation on grouped data
- Standard deviation of combined data
- combined mean, sizes n_1,n_2
- combined SD
- Finding a missing group from a combined variance
- Coefficient of Variation
- Comparing consistency with C.V.
- Symbols
- Traps that cost marks
- Tricks that save time
How CapCompass uses this sheet
These notes are not a standalone PDF. CapCompass plans Mathematics chapter by chapter against your real exam dates and free hours, and when the plan reaches Measures of Dispersion the sheet opens inside the study block itself — at the page covering the sub-topic that block is on, with the timer still running. Revision arrives at the moment the plan says revise, instead of having to be gone looking for.