Two-variable Data — Digital SAT SAT Math revision notes
A 3-page visual revision sheet for Two-variable Data, written for Digital SAT SAT Math. Formulas, diagrams and the traps that cost marks, laid out to be read the night before rather than the term before. Free, and it opens inside CapCompass.
 Page 1 as PDF
Two-variable Data in one look
a cloud of observations, and the line or curve drawn through the middle of it
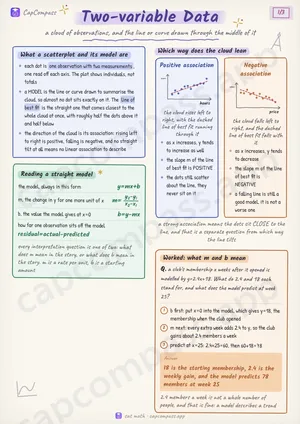
What a scatterplot and its model are
- each dot is one observation with two measurements, one read off each axis. The plot shows individuals, not totals
- a MODEL is the line or curve drawn to summarise the cloud, so almost no dot sits exactly on it. The line of best fit is the straight one that comes closest to the whole cloud at once, with roughly half the dots above it and half below
- the direction of the cloud is its association: rising left to right is positive, falling is negative, and no straight tilt at all means no linear association to describe
Reading a straight model
- the model, always in this form
y=mx+b - m, the change in y for one more unit of x
m=y_2-y_1/x_2-x_1 - b, the value the model gives at x=0
b=y-mx - how far one observation sits off the model
residual=actual-predicted
Which way does the cloud lean
- as x increases, y tends to increase as well
- the slope m of the line of best fit is POSITIVE
- the dots still scatter about the line, they never sit on it
- as x increases, y tends to decrease
- the slope m of the line of best fit is NEGATIVE
- a falling line is still a good model, it is not a worse one
Worked: what m and b mean
Q. a club's membership x weeks after it opened is modelled by y=2.4x+18. What do 2.4 and 18 each stand for, and what does the model predict at week 25?
- b first: put x=0 into the model, which gives y=18, the membership when the club opened
- m next: every extra week adds 2.4 to y, so the club gains about 2.4 members a week
- predict at x=25: 2.4×25=60, then 60+18=78
Answer: 18 is the starting membership, 2.4 is the weekly gain, and the model predicts 78 members at week 25
Page 1 of 3. The full sheet, all 3 pages, opens free in the app.
What this Two-variable Data sheet covers
- What a scatterplot and its model are
- Reading a straight model
- the model, always in this form
- m, the change in y for one more unit of x
- b, the value the model gives at x=0
- how far one observation sits off the model
- Which way does the cloud lean
- Positive association
- Negative association
- Worked: what m and b mean
- Worked: how far off the model an observation sits
- Linear or exponential, decided from a table
- Association is not cause
- Two growth shapes, side by side
- Pacing, the calculator, and the adaptive second module
- Traps that cost points
- Tricks that save time
How CapCompass uses this sheet
These notes are not a standalone PDF. CapCompass plans SAT Math chapter by chapter against your real exam dates and free hours, and when the plan reaches Two-variable Data the sheet opens inside the study block itself — at the page covering the sub-topic that block is on, with the timer still running. Revision arrives at the moment the plan says revise, instead of having to be gone looking for.
More SAT Math revision notes
- Area and Volume
- Circles
- Equivalent Expressions and Polynomials
- Evaluating Statistical Claims
- Inference and Margin of Error
- Linear Equations
- Linear Functions
- Linear Inequalities
- Lines, Angles, Triangles
- Nonlinear Equations in One Variable
- Nonlinear Functions
- Nonlinear Systems
- One-variable Data
- Percentages
- Probability and Conditional Probability
- Ratios, Rates and Proportions
- Systems of Equations
- Triangles and Trigonometry
- Units, Rates and Conversions