Statistics — Class 10 Maharashtra SSC Mathematics revision notes
A 4-page visual revision sheet for Statistics, written for Class 10 Maharashtra SSC Mathematics. Formulas, diagrams and the traps that cost marks, laid out to be read the night before rather than the term before. Free, and it opens inside CapCompass.
 Page 1 as PDF
Statistics in one look
three averages for grouped data, and the pictures that show a distribution at a glance
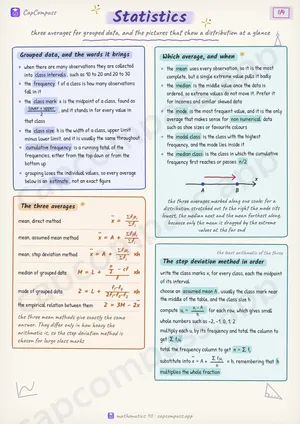
Grouped data, and the words it brings
- when there are many observations they are collected into class intervals, such as 10 to 20 and 20 to 30
- the frequency f of a class is how many observations fall in it
- the class mark x is the midpoint of a class, found as lower + upper/2, and it stands in for every value in that class
- the class size h is the width of a class, upper limit minus lower limit, and it is usually the same throughout
- cumulative frequency is a running total of the frequencies, either from the top down or from the bottom up
- grouping loses the individual values, so every average below is an estimate, not an exact figure
The three averages
- mean, direct method
x = Σ f_ix_i/Σ f_i - mean, assumed mean method
x = A + Σ f_id_i/Σ f_i - mean, step deviation method
x = A + Σ f_iu_i/Σ f_i × h - median of grouped data
M = L + fracn/2 - cff × h - mode of grouped data
Z = L + f_1-f_0/2f_1-f_0-f_2 × h - the empirical relation between them
Z = 3M - 2x
Which average, and when
- the mean uses every observation, so it is the most complete, but a single extreme value pulls it badly
- the median is the middle value once the data is ordered, so extreme values do not move it. Prefer it for incomes and similar skewed data
- the mode is the most frequent value, and it is the only average that makes sense for non numerical data such as shoe sizes or favourite colours
- the modal class is the class with the highest frequency, and the mode lies inside it
- the median class is the class in which the cumulative frequency first reaches or passes n/2
The step deviation method in order
- write the class marks x_i for every class, each the midpoint of its interval
- choose an assumed mean A, usually the class mark near the middle of the table, and the class size h
- compute u_i = x_i - A/h for each row, which gives small whole numbers such as -2, -1, 0, 1, 2
- multiply each u_i by its frequency and total the column to get Σ f_iu_i
- total the frequency column to get n = Σ f_i
- substitute into x = A + Σ f_iu_i/n × h, remembering that h multiplies the whole fraction
Page 1 of 4. The full sheet, all 4 pages, opens free in the app.
What this Statistics sheet covers
- Class interval
- Frequency
- Class mark
- Grouped data, and the words it brings
- The three averages
- mean, direct method
- mean, assumed mean method
- mean, step deviation method
- median of grouped data
- mode of grouped data
- the empirical relation between them
- Which average, and when
- Step deviation method
- Assumed mean
- The step deviation method in order
- A mean by the step deviation method
- Finding the median class carefully
- Finding the mode carefully
- What each symbol stands for
- Histogram
- Frequency polygon
- Ogive
- Pie diagram
- Pictures of a distribution
- Symbols in this chapter
- Traps that cost marks
- Tricks that save time
How CapCompass uses this sheet
These notes are not a standalone PDF. CapCompass plans Mathematics chapter by chapter against your real exam dates and free hours, and when the plan reaches Statistics the sheet opens inside the study block itself — at the page covering the sub-topic that block is on, with the timer still running. Revision arrives at the moment the plan says revise, instead of having to be gone looking for.