Statistics — Class 9 Maharashtra SSC Mathematics revision notes
A 3-page visual revision sheet for Statistics, written for Class 9 Maharashtra SSC Mathematics. Formulas, diagrams and the traps that cost marks, laid out to be read the night before rather than the term before. Free, and it opens inside CapCompass.
 Page 1 as PDF
Statistics in one look
collecting data into tables, the three averages for ungrouped data, and the pictures
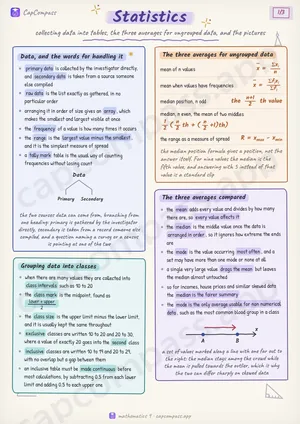
Data, and the words for handling it
- primary data is collected by the investigator directly, and secondary data is taken from a source someone else compiled
- raw data is the list exactly as gathered, in no particular order
- arranging it in order of size gives an array, which makes the smallest and largest visible at once
- the frequency of a value is how many times it occurs
- the range is the largest value minus the smallest, and it is the simplest measure of spread
- a tally mark table is the usual way of counting frequencies without losing count
Grouping data into classes
- when there are many values they are collected into class intervals such as 10 to 20
- the class mark is the midpoint, found as lower + upper/2
- the class size is the upper limit minus the lower limit, and it is usually kept the same throughout
- exclusive classes are written 10 to 20 and 20 to 30, where a value of exactly 20 goes into the second class
- inclusive classes are written 10 to 19 and 20 to 29, with no overlap but a gap between them
- an inclusive table must be made continuous before most calculations, by subtracting 0.5 from each lower limit and adding 0.5 to each upper one
The three averages for ungrouped data
- mean of n values
x = Σ x_i/n - mean when values have frequencies
x = Σ f_ix_i/Σ f_i - median position, n odd
the n+1/2 th value - median, n even, the mean of two middles
1/2left(n/2th + left(n/2+1right)thright) - the range as a measure of spread
R = x_max - x_min
The three averages compared
- the mean adds every value and divides by how many there are, so every value affects it
- the median is the middle value once the data is arranged in order, so it ignores how extreme the ends are
- the mode is the value occurring most often, and a set may have more than one mode or none at all
- a single very large value drags the mean but leaves the median almost untouched
- so for incomes, house prices and similar skewed data the median is the fairer summary
- the mode is the only average usable for non numerical data, such as the most common blood group in a class
Page 1 of 3. The full sheet, all 3 pages, opens free in the app.
What this Statistics sheet covers
- Primary and secondary data
- Frequency
- Range
- Data, and the words for handling it
- Class interval
- Class mark
- Inclusive and exclusive
- Grouping data into classes
- The three averages for ungrouped data
- mean of n values
- mean when values have frequencies
- median position, n odd
- median, n even, the mean of two middles
- the range as a measure of spread
- Mean median mode
- The three averages compared
- All three averages from one list
- Bar graph
- Histogram
- Frequency polygon
- Pie diagram
- The pictures
- A pie diagram sector
- Which average suits which data
- Symbols in this chapter
- Traps that cost marks
- Tricks that save time
How CapCompass uses this sheet
These notes are not a standalone PDF. CapCompass plans Mathematics chapter by chapter against your real exam dates and free hours, and when the plan reaches Statistics the sheet opens inside the study block itself — at the page covering the sub-topic that block is on, with the timer still running. Revision arrives at the moment the plan says revise, instead of having to be gone looking for.